The study compares heating and cooling for an average 150 m² house across six climates. It starts with the outcomes that matter most: lifetime cost and operational carbon, then shows how each system uses and shifts energy through the year. Zero-0 Core isolates the value of controllable thermal storage and dynamic operation. Zero-0 Solar adds on-site generation to the same system.
AVERAGE 150 M² HOUSE / 6 LOCATIONS
New York City / HOUSE
Zero-0 Solar delivers modeled lifetime heat at $89/MWh: 27% below air-source and 57% below geothermal. Its operational carbon intensity is 38 kgCO₂e/MWh: 60% below air-source and 37% below geothermal.
Building
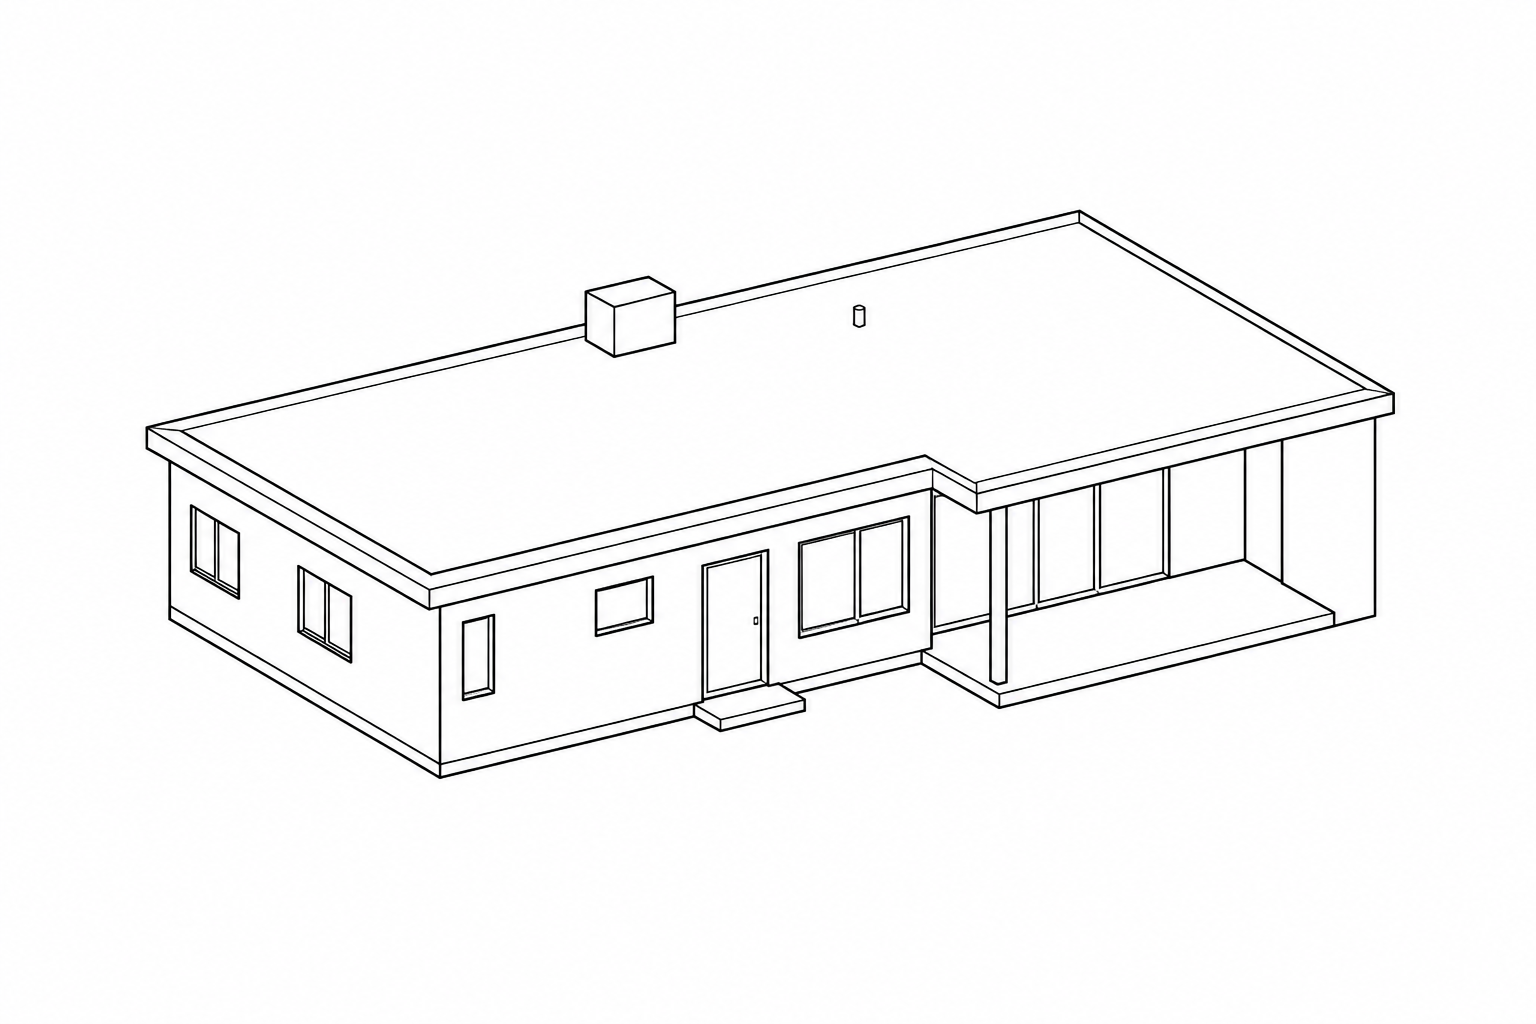
150 m² average house Reference conditioned floor area used for the residential comparison. “Average house” describes the archetype rather than a specific building.
Building peak load 2020
6.4 kW cooling Modeled peak thermal demand for the 2020 baseline, equivalent to about 43 W/m² for this case.
Building peak load 2050
7.6 kW cooling Modeled peak thermal demand for the 2050 weather scenario, equivalent to about 51 W/m² for this case.
Thermal storage
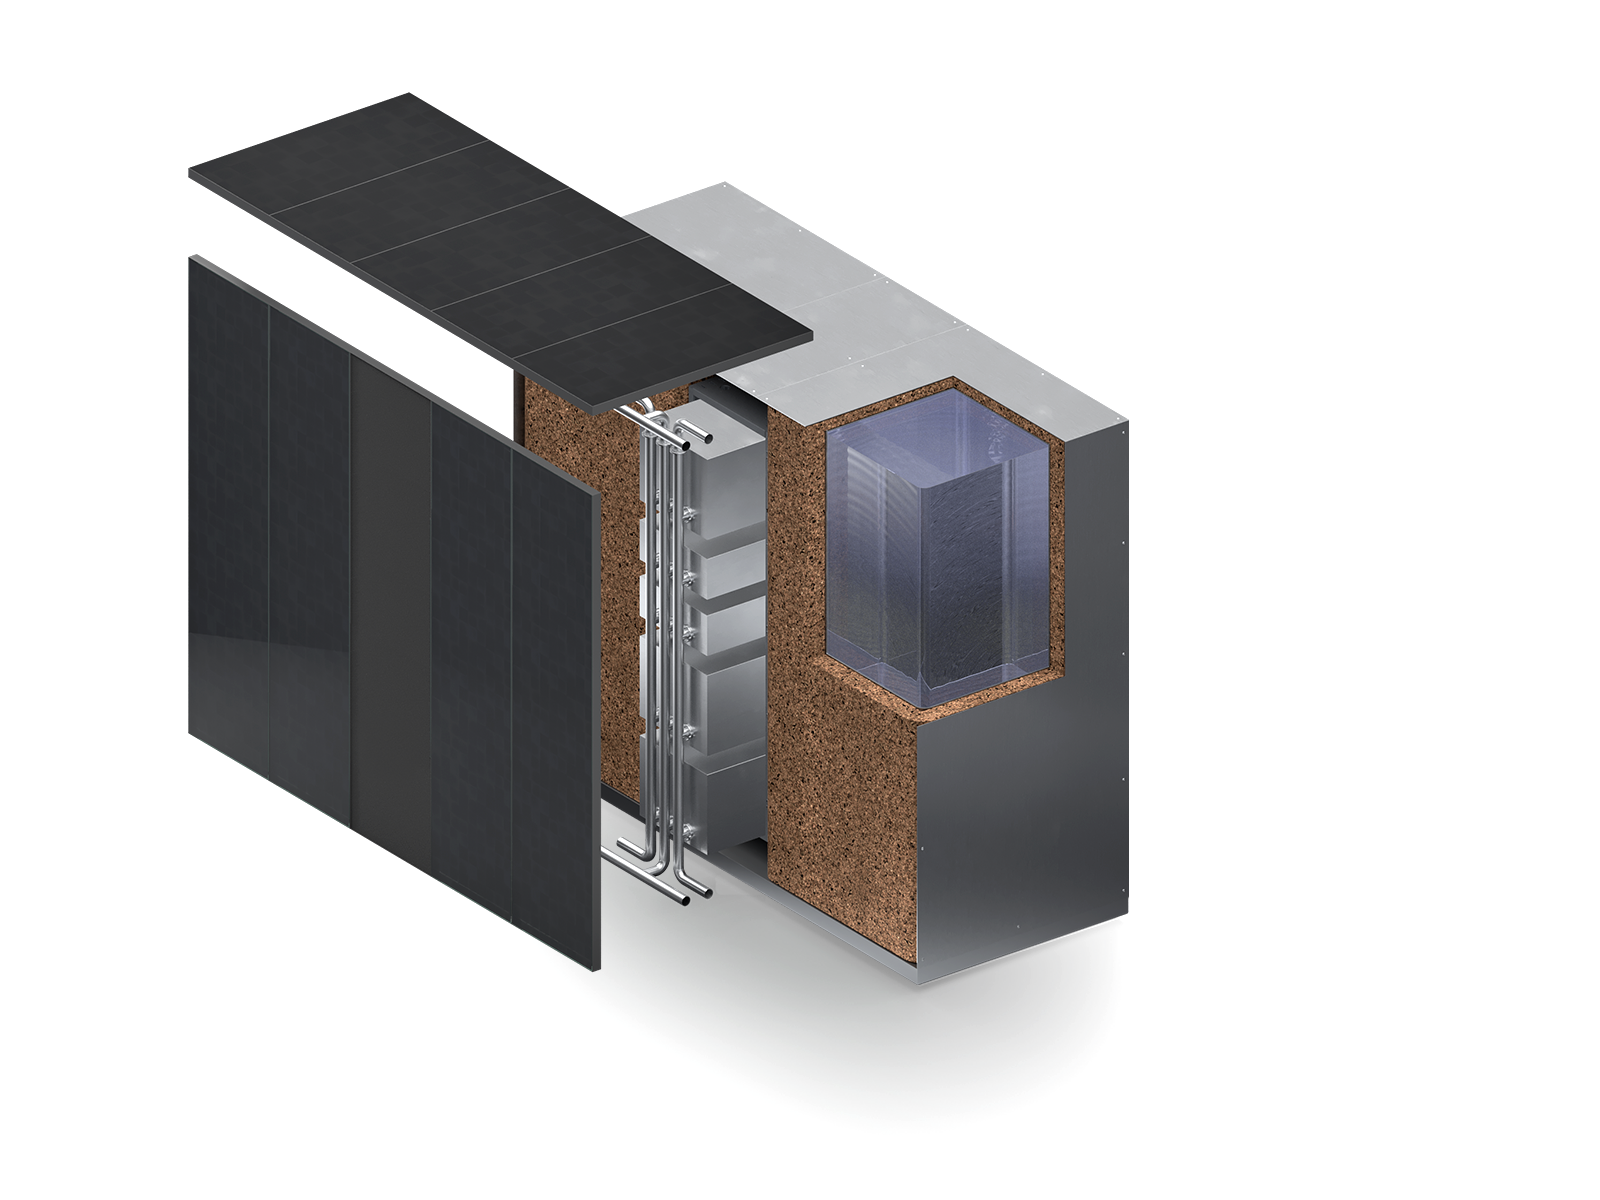
Up to 3,000 L water The study explored storage sizing as a design variable, seeking a balance between thermal performance, response and footprint. A 3,000 L water store spanning a full 20°C temperature difference holds about 70 kWh of sensible thermal energy—arithmetically around 10.9 hours at this case’s 6.4 kW 2020 cooling peak. This is an order-of-magnitude guide, not a guaranteed runtime: usable heating or cooling depends on temperature range, stratification, losses, emitter temperatures, heat-pump performance and controls.
Electrical storage
7 kWh battery Usable electrical storage included in this modeled scenario. The current product target is up to 10 kWh.
Orientation
South-facing The modeled Zero-0 unit orientation, including its optional solar collection surface.
ZERO-0 ENERGY UNIT / EXPLODED AXONOMETRIC
Levelized heat cost $/MWhThe archived 2023 lifetime cost of delivering one megawatt-hour of useful heating or cooling. It uses the study’s residential capital assumptions, modeled utility cost, system study life, a 3% discount rate and 3% annual electricity-cost escalation. Maintenance, replacements and subsidies were not included.
LIFETIME HEAT COST / INCLUDES CAPEX
91
Zero-0 Core
89
Zero-0 Solar
207
Geothermal
121
Air-source
Carbon intensity kgCO₂e/MWhOperational greenhouse-gas emissions associated with purchased grid energy, divided by useful heating and cooling delivered. Embodied emissions are excluded because the archived study did not contain a consistent, like-for-like material and installation inventory for every system.
OPERATIONAL CO₂ / LOWER IS BETTER
67
Zero-0 Core
38
Zero-0 Solar
60
Geothermal
94
Air-source
COPsystemWhole-system performance from the customer side of the meter: useful heating and cooling delivered divided by grid electricity purchased by the complete system. On-site solar generation is not counted as purchased input, so COPsystem can be much higher than the heat pump’s equipment COP. It must not be read as a standard heat-pump COP.
WHOLE SYSTEM / GRID-SIDE / HIGHER IS BETTER
3.7
Zero-0 Core
7.7
Zero-0 Solar
5.3
Geothermal
3.1
Air-source
MODEL BASIS / INPUTS
Capital inputs reflect the original November 2023 residential study. They are simulation assumptions, not current product prices or quotations.
Zero-0 Core
$27,00030-year study life
Zero-0 Solar
$30,00030-year study life
Geothermal
$60,00030-year study life
Air-source
$15,00020-year study life
Financial assumptions follow the archived 2023 study: 3% discount rate; 3% annual electricity-cost escalation; no subsidies, maintenance or replacement costs. Carbon intensity covers modeled operation only. Embodied carbon was not included because no consistent, like-for-like material and installation inventory was available for every system.
SUMMARY TABLE / Zero-0 SOLAR
Operational signatures
In the 2020 New York City model, Zero-0 Solar maintained 99.9% thermal comfort, bought 2,624 kWh from the grid and operated without grid imports on 67 days.
Thermal comfort The model targeted 20–25°C in operation. The reported thermal-comfort percentage counts 15-minute timesteps within the wider 18–27°C limits; above 98% is considered very comfortable.
99.9%202099.4% in 2050
Zero-grid days Calendar days with no grid electricity imported at any time, counted directly from the detailed simulation output.
67 days202050 days in 2050
Solar excess Solar electricity left after the Zero-0 system has used what it can. In practice, this surplus can readily power household appliances and other electrical loads; those uses are outside this system-only balance.
406 kWh2020312 kWh in 2050
Grid electricity Total electricity bought from the grid by Zero-0 Solar over the modeled year.
2,624 kWh20203,179 kWh in 2050
Average grid price The average price paid for electricity actually purchased. Dynamic control shifts demand toward lower-cost hours. As variable renewable generation expands, greater hourly price fluctuation could increase the value of this flexibility; that additional value is not modeled here.
0.063 $/kWh20200.110 $/kWh in 2050
Weekly electric energy
2020 bars and black 2050 markers share one scale.
Zero-0 Solar · 2020Zero-0 Core · 2020Geothermal · 2020Air-source · 2020Solar used · 2020Solar excess · 20202050
Monthly operating cost
Red rule marks a low-cost month Less than 0.100 $/m² in modeled grid-electricity cost in both the 2020 and 2050 scenarios. For this 150 m² average house, that means less than 15 $ in the month. It does not mean the building is disconnected from the grid.
Zero-0 Solar · 2020Zero-0 Core · 2020Geothermal · 2020Air-source · 20202050Low-cost month · below 0.100 $/m² in 2020 + 2050
PEAK RESPONSE
The heat pump covers sustained demand, while charged thermal storage supplies additional heating or cooling during peaks.
UNOCCUPIED PERIODS
During holidays or other unoccupied periods, the tanks can charge from on-site solar when conditions allow, or during low-cost grid hours. The stored reserve can bring the house back to temperature quickly before occupants return, while avoiding peak-price demand.
OTHER BUILDINGS
Zero-0 was also developed and simulated for warehouse-type buildings, small offices and commercial spaces. In these applications, a prefabricated external energy unit can add controllable thermal mass without occupying useful floor area or requiring a bespoke plant room. Those cases are intentionally not presented here.
MODELLING
The dynamic simulations were built in TRNSYS. Building geometry was prepared in SketchUp with Trnsys3D and resolved in TRNBuild. Location-specific EPW climate files came from the U.S. Department of Energy’s EnergyPlus weather database.
These figures are simulations from the November 2023 techno-economic study, not measured prototype performance. Operating cost excludes initial investment, installation, transport and maintenance; levelized heat cost includes the original modeled capital expenditure. The archived financial model uses a 3% discount rate, 3% annual electricity-cost escalation, and no subsidies, maintenance or replacement costs. Carbon figures cover modeled operation only. Embodied carbon is excluded because no consistent, like-for-like material and installation inventory was available for every system. On today’s carbon-intensive grids, operation generally remains the larger source of lifetime emissions for heating and cooling systems; as grids decarbonize, embodied impacts become more significant. These figures are therefore not a full lifecycle assessment.